 HackerTube.runGood videos, with context.
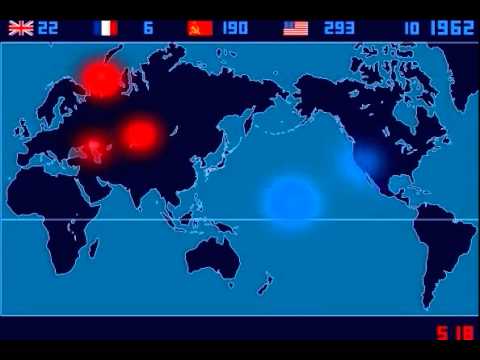
A Time-Lapse Map of Every Nuclear Explosion Since 1945 - by Isao Hashimoto
About this video
Isao Hashimoto's time-lapse map shows all 2053 nuclear explosions between 1945 and 1998, with each nation getting a blip and a running tally. Each second represents one month.
Why it appears in the archive
Used as a striking visualization of the sheer scale and rhythm of nuclear testing, and as a model for conveying scale with a counter.
AI-generated summary and labels from the source dataset; verify important details against the video. Source & credits.
From the Hacker News discussion
That opening paragraph really puts the following time-lapse animation showing every nuclear explosion since 1945 in perspective: [VIDEO] One of the most fascinating things is seeing how every string of nuclear tests in Russia were quickly followed by many more detonations in the US.
Read original comment ↗Here's a timelapse of every nuclear explosion since 1945. It really puts into perspective just how many nukes have gone off for purposes other than to kill people. It's amazing that only two were used for violence. [VIDEO] According to the video, people have detonated 2053 nukes, and America has the dubious distinction of having detonated over 1000.
Read original comment ↗Considering the impact of fishing perhaps a bit of paranoia will do good for the biosphere. Still I must point out that whatever radiation is released or will be released from Fukushima, is nothing compared to what nuclear weapons testing had done in the last century: [VIDEO] so enough scaremongering.
Read original comment ↗I don't understand why an accidental detonation of a warhead would produce "lethal" fallout. Yet there's comparatively little concern (and rightfully so) over the 2000+ intentional test detonations done around the world so far? [VIDEO]
Read original comment ↗I've always wondered why don't they allow the testing of those rockets in stable ground? We've done crazier tests, like nuclear testing: [VIDEO]
Read original comment ↗That site really drives the tragic results of drone strikes, however from a UX perspective, I wish they would not use a stacked sliding bar for the death count at the top. Seeing the death of children growing at the start is heart wrenching, but as the other values grow, the 'children' bar actually shrinks, devaluing the impact of the tragic toll. Perhaps counters like the "Every Atomic explosion since 1945 video"? [0] Might drive home the point a little better? [0] - [VIDEO]
Read original comment ↗Related, and from the title I actually thought it was going to be this: "A Time-Lapse Map of Every Nuclear Explosion" [VIDEO]
Read original comment ↗Bloomberg did a good mini-doc on pfas 8 months back; [LINK] I suspect it might end up being an all or the above kind of situation, perhaps mixed in with transgenerational effects from atmospheric atomic tests and so forth ( [VIDEO] , [LINK] , & [LINK] )
Read original comment ↗