 HackerTube.runGood videos, with context.
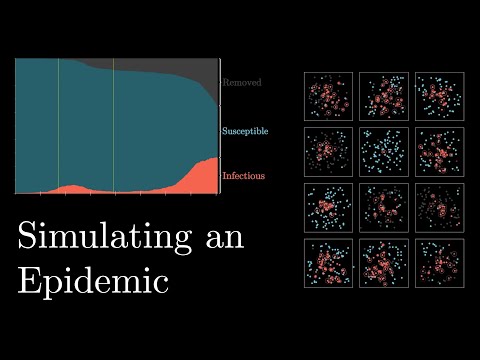
Simulating an epidemic
About this video
3Blue1Brown builds toy SIR models to simulate how an epidemic spreads and tests scenarios like social distancing, travel restrictions, central gathering places and quarantine. It was made during the early COVID-19 outbreak.
Why it appears in the archive
HN pointed to it during 2020 as a digestible, well-made illustration of epidemic dynamics and interventions.
AI-generated summary and labels from the source dataset; verify important details against the video. Source & credits.
From the Hacker News discussion
Part of 3 Blue 1 Brown's excellent latest video simulates travel restrictions and suggests they're not very effective: [VIDEO] . However, that was only for cutting travel between all communities by a factor of 4, rather than completely banning travel between two particular communities / countries.
Read original comment ↗Garrett, thank you. * * * My inspiration for writing this came from watching 3Blue1Brown's YouTube video, "Simulating an epidemic": [VIDEO] His simulations cover several scenarios: - Simulating social distancing. - Having people travel to a central location (e.g. a grocery store). - What if the government is able to identify and isolate cases? - Simulating multiple communities with travel, that put quarantine measures in place. - What happens when people get tired of social distancing. * * * Thanks for sharing your code. I see that you are using gnuplot to visualize the output of the script. Have you considered using the csv module ( [LINK] ) to output the data, instead of using the print() function? That way, you wouldn't have to manually add in spaces around the data and stringify the numeric data. >>> import csv, sys >>> writer = csv.writer(sys.stdout, delimiter=" ") >>> writer.writerow(["#", "T", "S", "I", "R"]) # T S I R In the script, usage would look something like this: import csv import sys ... writer = csv.writer(sys.stdout, delimiter=" ") writer.writerow(["#", "T", "S", "I", "R"]) writer.writerow([T, S, I, R]) while I > 1000: ... writer.writerow([T, S, I, R])
Read original comment ↗If we can test and isolate, we can manage how the disease progresses through society, with a (very very slight, now) chance of stopping it. While not scientific, this is illustrative and well done that shows many aspects of disease spread: [VIDEO]
Read original comment ↗Homemade masks made of a double layer of tea towel cloth are not only protecting others but also protect yourself nearly as effectively as N95 masks. The original research was made by PHE - Public Health England and the results are: B atrophaeus - ~1um : Surgical mask 96.35% filtering Double layer tea towel 96.71% filtering Bacteriophage MS2 - 23nm : Surgical mask 89.52% filtering Tea towel one layer 72.46% filtering The full paper is on researchgate, title: "Testing the Efficacy of Homemade Masks: Would They Protect in an Influenza Pandemic?" Also every super market should have the use of hand sanitizer obligatory at the entrance. There is a pretty good video for simulations of the epidemic spreading [1] - it is not going to stop until we either have a vaccine or ~60% of the population have antibodies. So the choice is to sit the next 12-18months at home or we fight the transmission of the virus. Masks cost nothing compared to the economic disaster that we are running into. The virus spreads via mouth and nose and secondary via the hands. So just stop it at the source. [1] [VIDEO]
Read original comment ↗> ...noticeable reduction in the spread? I believe the SIR model [0] answers those questions. 3blue1brown's video on the topic is super digestible and informative [1]. In short, the discovery of a prophylactic if not a therapeutic treatment are our best immediate bets, absent which, quarantines and lockdowns will have to persist to curb the spread of a disease as infectious as covid-19 whilst we patiently wait for an effective vaccine against it [2]. [0] [LINK] [1] [VIDEO] [2] [LINK]
Read original comment ↗BTW, he's currently co-teaching a course on Julia with some really great lectures on computational thinking: [LINK] He also had a nice video about epidemics/pandemics: [VIDEO] All using manim for visualizations.
Read original comment ↗> Technocrats used complicated mathematical models to determine that mass vaccination would create a "herd immunity" to disease. The SIR model is very simple [LINK] At the beginning of the covid19 epidemic everyone and their dog was writing one and publishing a demo version. It was interesting/scary to modify the parameters and see how thing changed. Also, try to fix misinformation in the models, like a 50% death rate. Anyway, a SIR model can be programed in 20 lines of codes, and is pretty straightforward. Adding a vaccine is like 5 additional lines at most. Also, the main idea is very simple to understand. (Someone should write a tutorial of SIR in Excel/GoogleSheets, it's interesting to see the graphics.) The most simple models just assume that everyone meets everyone randomly. It's more complicated if you want to consider a more realistic model of how people move. For a decision about lockdown you need the complex model, but to understand herd immunity the simple model is good enough. For a nice explanation of more complicated models, there is a video of 3Blue1Brown: "Simulating an epidemic" [VIDEO] Note that he explains that the models in this video are not 100% accurate, some number are chosen to get nice graphics, they are only useful to get some insight but not get quantitative predictions.
Read original comment ↗Dynamics of the virus spread is quite interesting. 3Blue1Brown made a fascinating video about how an epidemic spreads: [VIDEO]
Read original comment ↗